
iDevBooks, makers of many excellent math apps, now brings us, World Factbook Visual Edition, a fantastic app to help us interpret almanac facts about the world. Pulling information from The World Factbook 2013-2014 put out by the Central Intelligence Agency, the app will be regularly updated to keep it current. It’s different from other similar apps in that it really helps users visualize the data, and doesn’t just display tables of numbers.
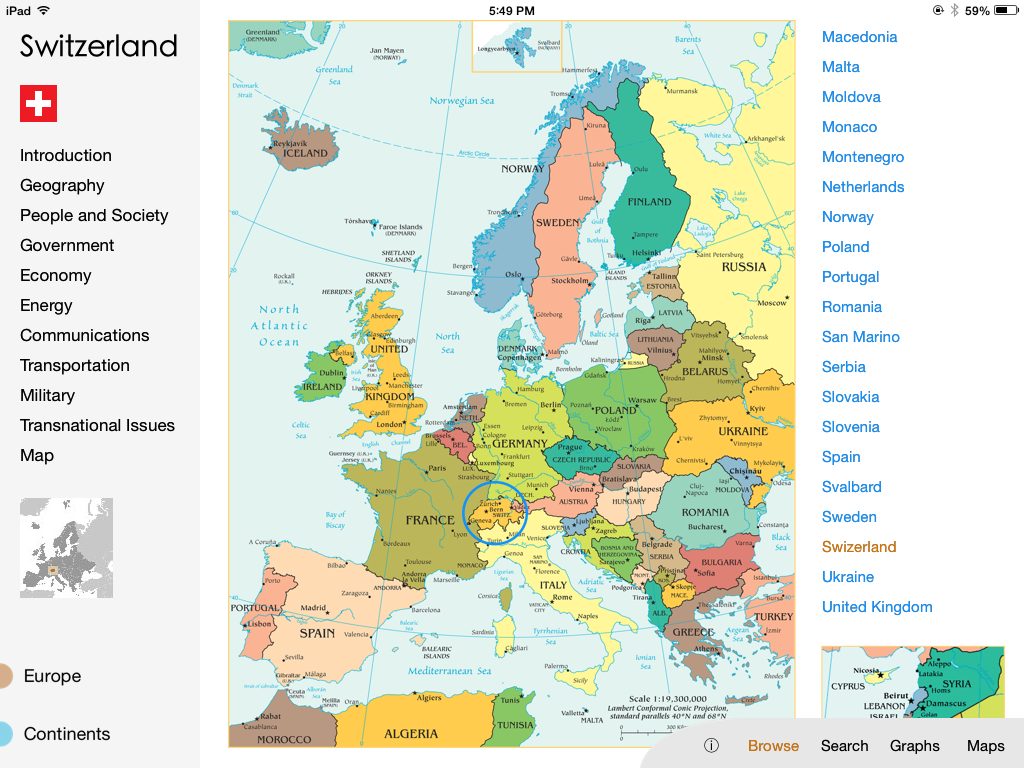
You can peruse the data within the app in several different ways. Start with Browse, where you can tap on a map or on text labels for areas of the world. You then zoom into that area of the map where you can tap on specific countries. The app then circles that country on the map, and gives you a menu on the left where you can get facts about the country such as geography, its people and society, government, economy, transportation, etc. It does treat the Southern Ocean as its own, separate ocean, which I’ve seen in a few other reference works, too.

If browsing isn’t your thing, use Search to scroll through all of the countries and areas, or type in search terms which it will narrow down your choices as you type.

Tap Graphs for a long list of various data maps, including population, life expectancy, area, exports, internet, and roadways. You can tap the bar graph or the map for each one, and it will give you your data as you prefer it.

The Maps section has a selection of maps for each continent and world region, including time zones, shipping lanes, and oceans. Most of the areas included have geographic and political maps to study, which are zoomable.

World Factbook Visual Edition costs $3.99 and comes out August 21, 2014. It is a wonderful way to learn about the countries of the world in a very visual way. Numbers have a harder time conveying their impact, but the maps, graphs, and colors in this app demonstrate them perfectly. I’ve already put in a feature request to be able to compare two countries’ data, side by side. iDevBooks is always open to feedback on their apps, including feature requests, so share your ideas with the developer!
Note: I received this app for review purposes.