
As I mentioned in my post last week, announcing our giveaway of a Tektronix TBS1202B oscilloscope, an oscilloscope can be one of the most powerful tools on a electronics work bench. I thought I would take some time to explain how a scope can be useful, and highlight some of the features of the TBS1202B.
At its most basic level, an oscilloscope presents the user with a plot of the voltage over time, with voltage on the vertical axis and time across the horizontal. Think of it this way, it is like using a digital multimeter but as the values change, you have a record of those changes. When you have a system that is in steady state, the display will be very boring. A horizontal line at a voltage level. However, as soon as you are looking at the most basic signals, it becomes very interesting and an indispensable tool.
Let’s look at a very basic example. I am sure many of you are familiar with the Arduino and its most basic “Hello, World” program, Blink. For those that are not familiar, the blink program simply blinks an LED on and off once every second. It is a trivial program and very simple and used as a first hardware/software checkout and tutorial on many platforms. Beyond the basic lighting up of the LED, there is a world of interesting information you can get out of this simple program when you look at it running on an oscilloscope.
First, we can look at the large view of the signal itself, capturing a train of square wave signals with a period of 1 second.
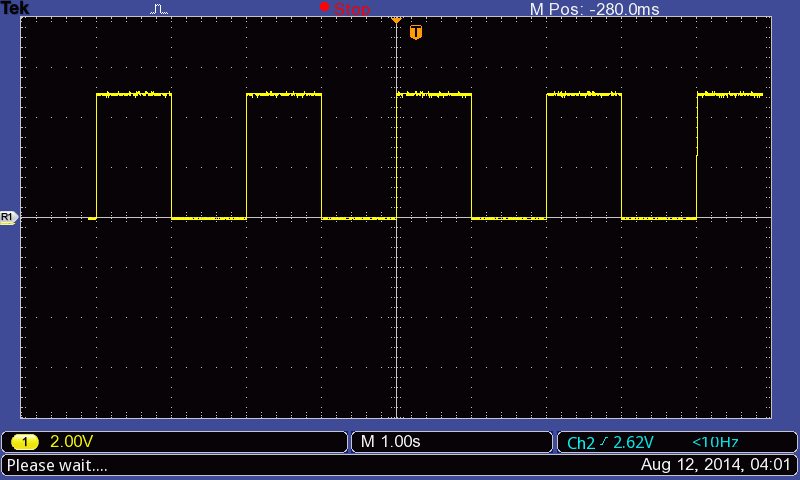
Pretty easy to understand what is happening. We see the voltage swing better 0 V and +5 V. This is basically a clock pattern and easy to read.
The dotted lines that form a grid are a reference. If you look along the bottom you can see that I am looking at a yellow signal, channel 1 and the horizontal dotted lines mark 2 V intervals between +5 V and 0 V as expected. We can also see that the signal is high for 1 second and then low for one second and repeats. Nothing drastic but a nice visualization and exposure to the environment.
The transition from 0 V to 5 V appears to be a pretty straight vertical line, but if we zoom in, we can see that it is not instantaneous.

What you are looking at is one rising edge of Arduino pin 13 going high at a resolution of 25 nanoseconds per division. We can see that the rise time is extremely rapid, but not instantaneous. Using the measurement function, we can precisely how long it took.
We can see that not only is the rise time 10 nanoseconds, the voltage actually overshoots +5 V to just over +6 V and takes 25 nanoseconds to settle out. These are really interesting observations on a fairly simple operation. In a more complex environment, this could be very important information. For example, if I modify the classic blink program to blink a second LED opposite the pin 13 LED, we would likely see two waveforms on the display that look like they change at the same time.
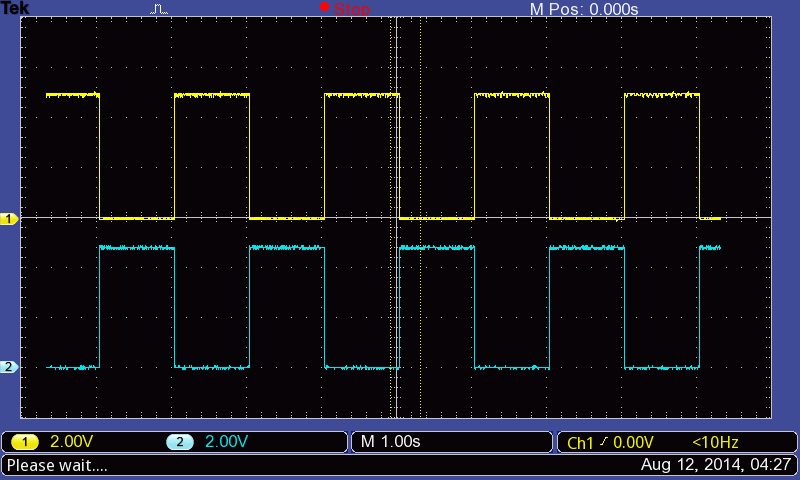
However, if we zoom in again, we can see that these transitions start at different times. The Arduino clock is running at 16 MHz or 1 clock cycle every 0.0625 microseconds. This means that the Atmel ATMega microcontroller is executing 640 clock ticks’ worth of execution between the two actions. Again, not a big deal here and an imperceptible change, but you start to see the power of having a tool such as an oscilloscope.

All of these measurement were capture on an identical Tektronix oscilloscope to the one we are giving away. Please check out my announcement post from last week and enter to win either there or on the form below. The contest ends August 31st at midnight! Many thanks to our friends at Tektronix!


I am using a tektronix T932 35 mhz oscilloscope now and love it although it is kinda old and I could use a new one.
Thank you very much … Dick Baublitz xpi
389 Ruby Lane, Carson City, Nevada 89706